VSC Mixer Vibration Case Study
VSC was asked by a client to conduct a vibration analysis survey on a Mixer that was experiencing elevated vibration. Our personnel went onsite and found the peak vibration was coming from the inboard mixer bearing. The vibration we initially recorded was excessive with the highest readings reaching over 1.5 inches per second (ips) as shown in figure 2, below.
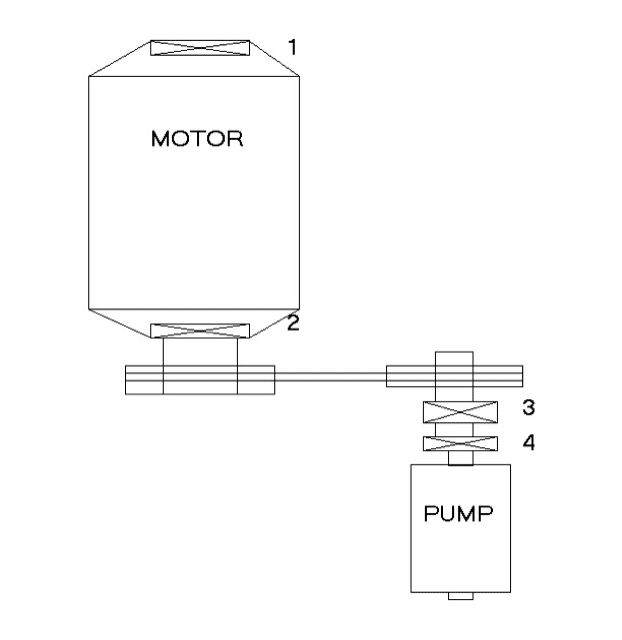
Figure 1: Mixer Drawing
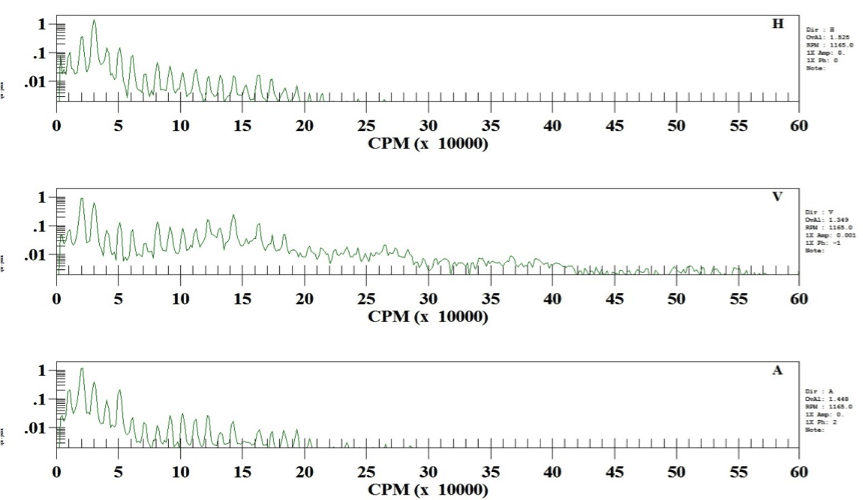
Figure 2: IB Mixer Bearing worn bearing
The vibration spectra in figure 2 show strong harmonics of the mixers operating speed along with a raised noise floor. These types of symptoms indicate a mechanical looseness condition coming from this bearing. Usually a looseness condition is the result of improper metal to metal connections rattling together. Some good examples include loose bolts, broken or cracked welds and worn bearings.
Our personnel inspected the bearings and foundation and supporting structure for any signs of cracks and loose bolting that could create this vibration. Since the main structure was stout enough and we found no cracks, broken welds or loose bolts, we moved to the bearings.
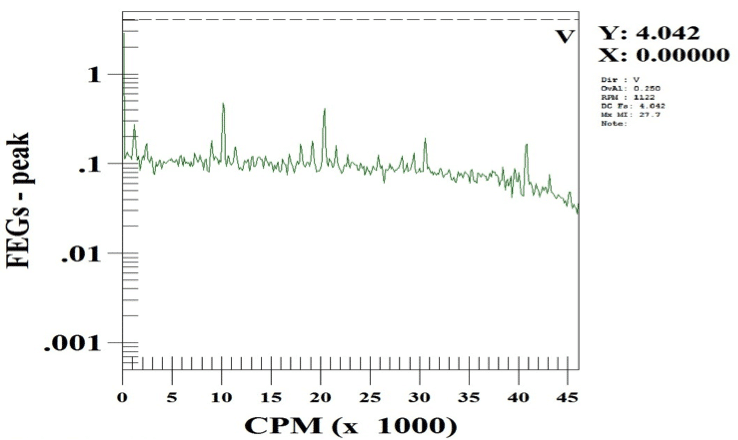
Figure 3: Inboard Mixer Bearing envelope spectrum with bad bearings
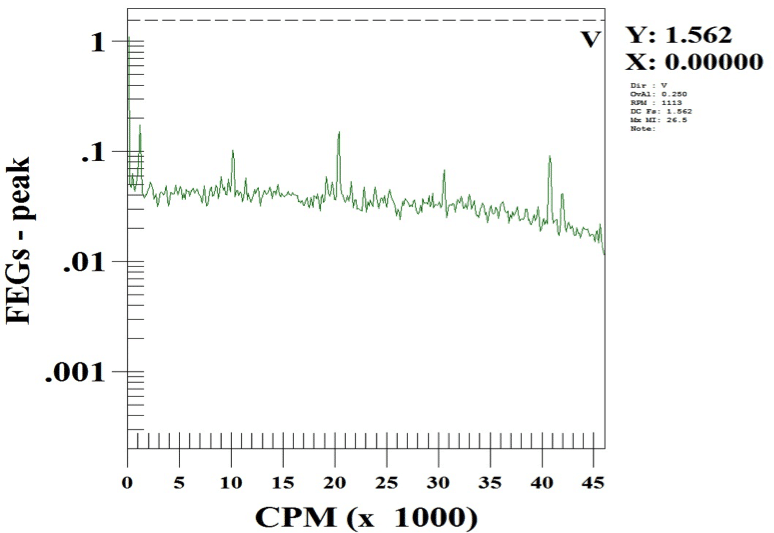
Figure 4: Outboard Mixer Bearing envelope spectrum with bad bearings
The envelope spectra from the mixer bearings showed DC levels between 1.5 and 4 g’, indicating very poor bearing conditions. There were also strong peaks of the bearing fault frequencies, signifying considerable bearing wear. Figure 5 is the time waveform data from the outboard mixer bearing that reveals high frequency impacting of the bearing frequencies demonstrating the substantial bearing wear.
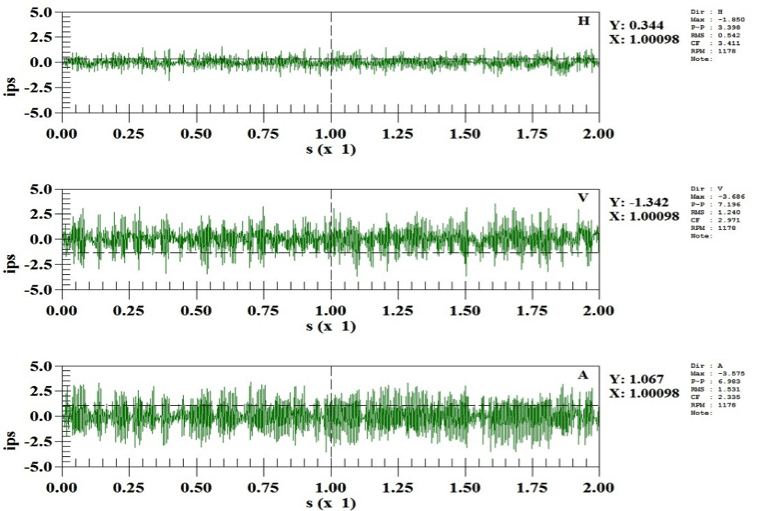
Figure 5: Outboard Mixer bearing high frequency bearing time waveform vibration
All of the vibration spectra, waveforms and envelope data designated that the bearings needed replacement. Our client quickly replaced the bearings and the vibration levels dropped considerably in all of the different types of data.
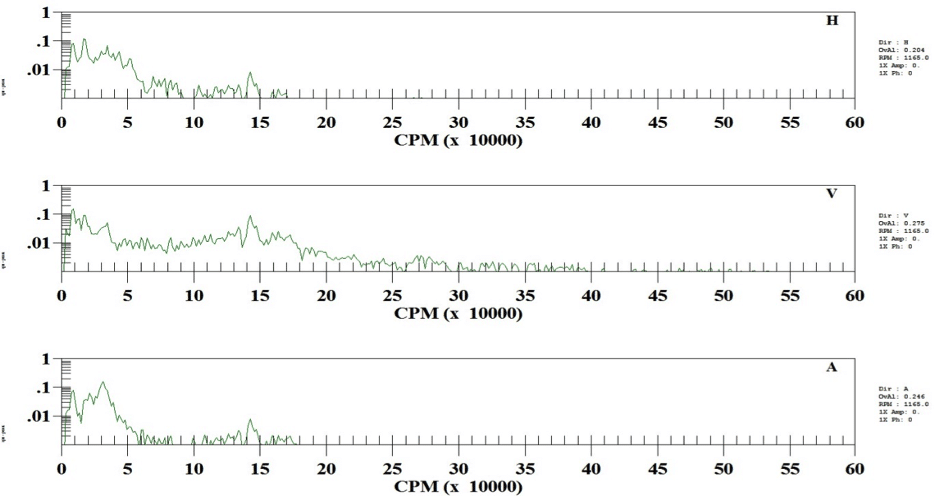
Figure 6: IB Mixer Bearing after new bearings
In figure 1, the data showed as found overall vibration levels over 1.5 ips, while figure 6 disclosed overall vibration readings below 0.28 ips after the bearing replacement. Figure 7, below, illustrates the envelope vibration DC levels below 0.1 g’ after the bearing replacement while figure 4, above, has the excessive reading of 4 g’ with the worn bearings.
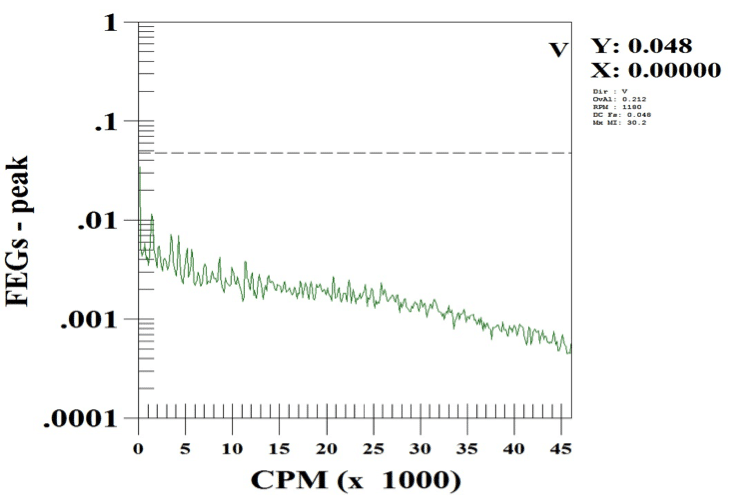
Figure 7: IB Mixer Bearing after new bearings
Finding and fixing machinery problems are so much easier when you employ numerous data types to confirm your diagnosis. Below, figure 8 shows the time waveform data which, like the envelope readings in figure 7, discloses significantly lower levels and no indication of bearing problems any more.
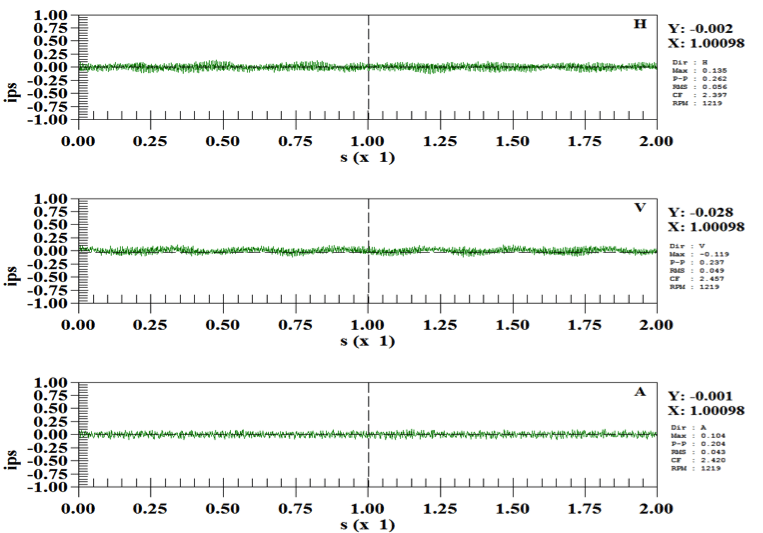
Figure 8: IB Mixer Bearing after new bearings
Vibration analysis offers unmatched machinery condition diagnostics that turn every maintenance program from reactive to proactive. If you want a 21st century intelligent maintenance program, contact VSC and see your machinery problems well before they head off the rails.